Fractal Engine Request access

Invite-only indicator for TradingView

The market has run this
pattern before.

Fractal Engine takes the window of price action you are trading right now, slides it back across the instrument's own history, and finds the windows that moved the same way. It then draws what happened next — as a consensus path, a fan of individual outcomes, and a range wide enough to size risk against.

$10 per month or $100 once. Access is granted manually to your TradingView username.

Live view Tap a marker to read that element
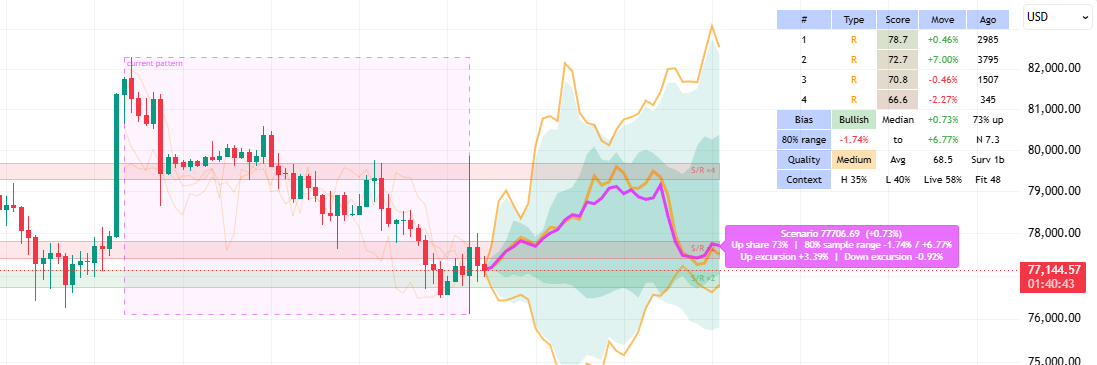
Fractal Engine on a BTCUSD chart: a dashed window marks the current pattern, orange lines project four historical continuations, a magenta consensus path runs through a teal expected-range cloud, and a metrics panel sits in the top right.
Four surviving analogs on a 4-hour chart. Bias reads bullish, median outcome +0.73%, sample range −1.74% to +6.77%.

The pattern window

The dashed box holds the stretch of price action being matched — the most recent N bars, normalised so that shape matters and absolute price does not. Everything else on the chart is downstream of this box.

Reading it: if the window closes over a stretch with no real structure, expect the scores below to come back weak. The engine is honest about a flat sample rather than inventing a story from it.

Scenario paths

Each orange line is one historical continuation: what the instrument actually did in the bars after a window that looked like yours. It is rescaled onto the current price so you can read it in today's numbers.

Reading it: watch where they separate. Paths that agree for twenty bars and then fan out are telling you the near term is readable and the rest is not.

Consensus path

The magenta line is the weighted centre of the surviving scenarios — higher-scoring analogs pull it harder. It is the single most representative outcome of the set, not a forecast.

Reading it: treat it as a centre of gravity. Price leaving the cloud entirely says more than price wandering above or below this line.

Expected range cloud

The teal band is the dispersion of the active scenarios around the consensus. It answers a different question from direction: how much do the analogs disagree?

Reading it: a narrow cloud is a tight sample and a tighter stop. A cloud that balloons within a few bars is the engine telling you the history it found has no opinion.

Support and resistance bands

Horizontal zones drawn from levels price has already respected, labelled with how many times they were touched — S/R ×4 carries more weight than S/R ×2.

Reading it: the interesting moments are where a band and the consensus path collide. That is where continuation and rejection are both live and where a plan is worth writing down.

Scenario label

The tag pinned to the projection carries the headline numbers: the consensus endpoint in price and percent, the share of scenarios leaning up, the 80% sample range, and the average excursion each way.

Reading it: the excursions matter most. A scenario that ends +0.73% after dipping −0.92% and spiking +3.39% is a very different trade from a quiet drift to the same close.

Metrics panel

The compact table in the corner reduces the whole set to numbers: the top-ranked analogs, the aggregate bias, the sample range, and a quality read on whether the set deserves your attention.

Reading it: read quality and context before direction. A bullish bias on a weak, unsupported sample is not a bullish read. Full reference below.

Platform
TradingView, invite-only script
Markets
Anything with enough history — crypto, FX, indices, equities
Method
Normalised pattern matching, forward and inverted
Output
Scenarios, consensus, range, and a scored confidence read

Four steps, every time the bar closes

Nothing here is a black box. The engine does the same four things on every instrument and every timeframe, and shows its work at each stage.

  1. 01

    Match

    The current window is normalised and slid across the instrument's history, bar by bar, looking for stretches that moved the same way. Mirror images count too — a candidate that ran the inverse of your pattern is kept and marked R for reverse.

  2. 02

    Rank

    Every candidate is scored on how closely it fits, then filtered. Matches that overlap each other, sit too close in time, or fall below the fit threshold are dropped so the survivors are genuinely independent samples rather than the same event counted four times.

  3. 03

    Project

    What followed each surviving match is rescaled onto the current price and drawn forward. The weighted centre becomes the consensus path; the spread becomes the expected-range cloud.

  4. 04

    Score

    The set is reduced to a panel: bias, median move, upward share, an 80% sample range, and quality and context readings that tell you how much weight the whole picture deserves.

The panel, line by line

Every field in the on-chart table, in plain language. This is the part most indicators leave you to guess at.

Scenario rows

The top-ranked analogs currently driving the projection.

#
Rank within the surviving set. Row 1 carries the most weight in the consensus path.
Type
How the analog was matched. N ran in the same direction as your window; R ran the mirror image.
Score
Fit quality for that analog, out of 100. Above roughly 70 is a close structural match; the low 60s is loose.
Move
Where that analog ends over the projection horizon, as a percentage from the current price.
Ago
How many bars back the analog was found. A spread of ages is healthier than four matches from the same month.

Aggregate read

The whole surviving set, collapsed into four numbers.

Bias
Net direction of the weighted set. A label, not a signal — always read it next to Quality.
Median
The middle outcome across active scenarios. More robust than the mean when one analog runs away.
Up share
Share of scenario weight pointing upward. 73% up means roughly three in four of the weighted set closed higher.
80% range
The span that contains eight out of ten historical outcomes. This is the number to size a stop and a target against.

Confidence

Whether the numbers above are worth acting on at all.

Quality
A single read on the strength of the current set — low, medium, or high.
Avg
Mean score of the active analogs. Drifting down means the matches are getting loose.
N
Effective sample size after weighting. A large raw count with a small N means one analog is dominating.
Surv
How much of the candidate pool survived filtering — the engine's own audit of its sample.

Context

Whether the rest of the chart agrees with the projection.

H
Agreement with higher-timeframe structure.
L
Agreement with lower-timeframe behaviour.
Live
How well price is currently tracking the projection as bars print.
Fit
Overall structural fit of the current window to what was found.

A practical rule: when quality is medium or better and context is aligned, the bias and the 80% range are worth building a plan around. When quality drops or context splits, the honest reading is that history has nothing useful to say about this bar — which is itself information.

How traders actually use it

Three jobs it does well. It is a context layer, so it sits underneath whatever you already trade.

Framing a bias before the session

Open the chart, read quality and context first, then bias and the 80% range. You arrive at the session with a directional lean and a defined band instead of reacting to the first candle you see.

Choosing where risk goes

The range cloud and the 80% sample range give you a distribution rather than a guess. Stops go outside where the analogs disagreed; targets go where they clustered.

Knowing when to stand down

A weak sample, a fan that splits immediately, or context pulling against the projection are all reasons to not take the trade. Filtering out bad conditions is the least glamorous edge and the most durable one.

What it doesn't do

Worth stating plainly, because plenty of tools in this category imply otherwise.

  • It doesn't issue buy or sell signals. There is no entry arrow and no alert telling you to act. You read the distribution and decide.
  • It doesn't predict. Analogs describe how similar structures resolved in the past. That is evidence, not a forecast.
  • It isn't a strategy or a bot. Nothing is automated, nothing is backtested into an equity curve, no orders are placed.
  • It doesn't replace risk management. The range tells you where outcomes fell. Position size is still yours.

Access

One script, two ways to pay for it, granted by hand to your TradingView account.

Monthly

$10per month

Renewed manually. Stop whenever you like.

Pays for itself in ten months

Lifetime

$100once

Every future update included, no renewal.

Both include

  • The indicator on your TradingView account, on every chart and timeframe
  • All future versions and parameter updates
  • The reading guide on this page
  • Direct support on Telegram

Getting set up

  1. Message @mhmk1995 on Telegram and say which plan you want.
  2. Send your TradingView username — the one in your profile URL, not your display name.
  3. Complete payment, then access is added to your account.
  4. Open TradingView and find Fractal Engine under Indicators → Invite-only scripts.
Message @mhmk1995

Questions

Which markets and timeframes does it work on?

Anything on TradingView with enough history behind it — crypto pairs, FX, indices, equities, commodities. The only real constraint is bar count: the engine needs a deep enough history to find independent matches, so very new listings and very high timeframes on young instruments will return thin samples. It will tell you when that happens rather than filling the gap.

Is this a signal service?

No. There are no entries, no alerts to follow, and no claim about what price will do. It is an analysis layer that shows you how comparable structures resolved, so you can make your own call with better context than a bare chart gives you.

Does the projection change as new bars print?

Yes, and it should. The matching window moves with the market, so as new bars close the set of analogs is recalculated and the projection updates. That is the tool working, not a defect — treat the projection as a live read on current conditions rather than a line to be held to.

Do I need to know how to code or configure anything?

No. It runs with sensible defaults the moment you add it to a chart. The settings are there if you want to change the window length, the projection horizon, or how many scenarios are drawn, but nothing needs touching to get a usable read.

What do you need from me to grant access?

Only your TradingView username — the one that appears in your profile URL. Access is added manually to that account, so a display name or an email address won't work.

Monthly or lifetime?

Monthly if you want to try it against your own markets for a cycle or two. Lifetime if you already know this is how you read charts — it breaks even at ten months and includes every update after that.

Can I see it on my own chart before paying?

Ask on Telegram. Screenshots on the instrument and timeframe you actually trade are usually more convincing than anything on this page.

Put history on your chart.

Send your TradingView username and you can be reading scenarios on your own instruments today.

Request access
$10/mo · $100 lifetime Request access